Hamilton UI
Hamilton comes with a fully open-source UI that can be run both for local deployment and on a remote server. The UI consists of the following features:
Telemetry for hamilton executions – both on the history of executions and the data itself.
A feature/artifact catalog for browsing/connecting executions of nodes -> results.
A dataflow (i.e. DAG) visualizer for exploring and looking at your code, and determining lineage.
A project explorer for viewing curating projects and viewing versions of your Hamilton dataflows.
In short, the Hamilton UI aims to combine a large swath of MLOps/data observability systems in one simple application.
Overview
If you’d like a video walkthrough on getting set up, you can watch the following:
If you’d like a quick overview of some of the features, you can watch the following:
Getting Started
The Hamilton UI is contained within a set of docker images. You launch with docker-compose, and it will start up the UI, the backend server, and a postgres database.
Prerequisites
To run this, you’ll need:
Docker installed – you can follow instructions here.
A Hamilton workflow – if you don’t have this there’s an init command that will create a basic one for you.
The hamilton repository cloned locally.
Starting the UI
Start by ensuring that the hamilton repository is cloned locally. Then, navigate to the ui directory:
git clone https://github.com/dagworks-inc/hamilton
Then, navigate to the ui directory:
cd hamilton/ui
And run the server command:
./deployment/run.sh
This will do the following:
Pull all docker images from the docker hub
Start a local postgres database
Start the backend server
Start the frontend server
This takes a bit of time! So be patient. The server will be running on port 8242. Then navigate to http://localhost:8242 in your browser, and enter your email (this will be the username used within the app).
Building the Docker Images locally
If building the Docker containers from scratch, increase your Docker memory to 10gb or more – you can do this in the Docker Desktop settings.
To build the images locally, you can run the following command:
# from the hamilton/ui directory
./deployment/dev.sh --build
This will build the containers from scratch. If you just want to mount the local code, you can run just
./deployment/dev.sh
Running your first dataflows
Now that you have your server running, you can run a simple dataflow and watch it in the UI! You can follow instructions in the UI when you create a new project, or follow the instructions here.
First, install the SDK:
pip install "sf-hamilton[sdk]"
Then, navigate to the project page (dashboard/projects), in the running UI, and click the green + New DAG button.
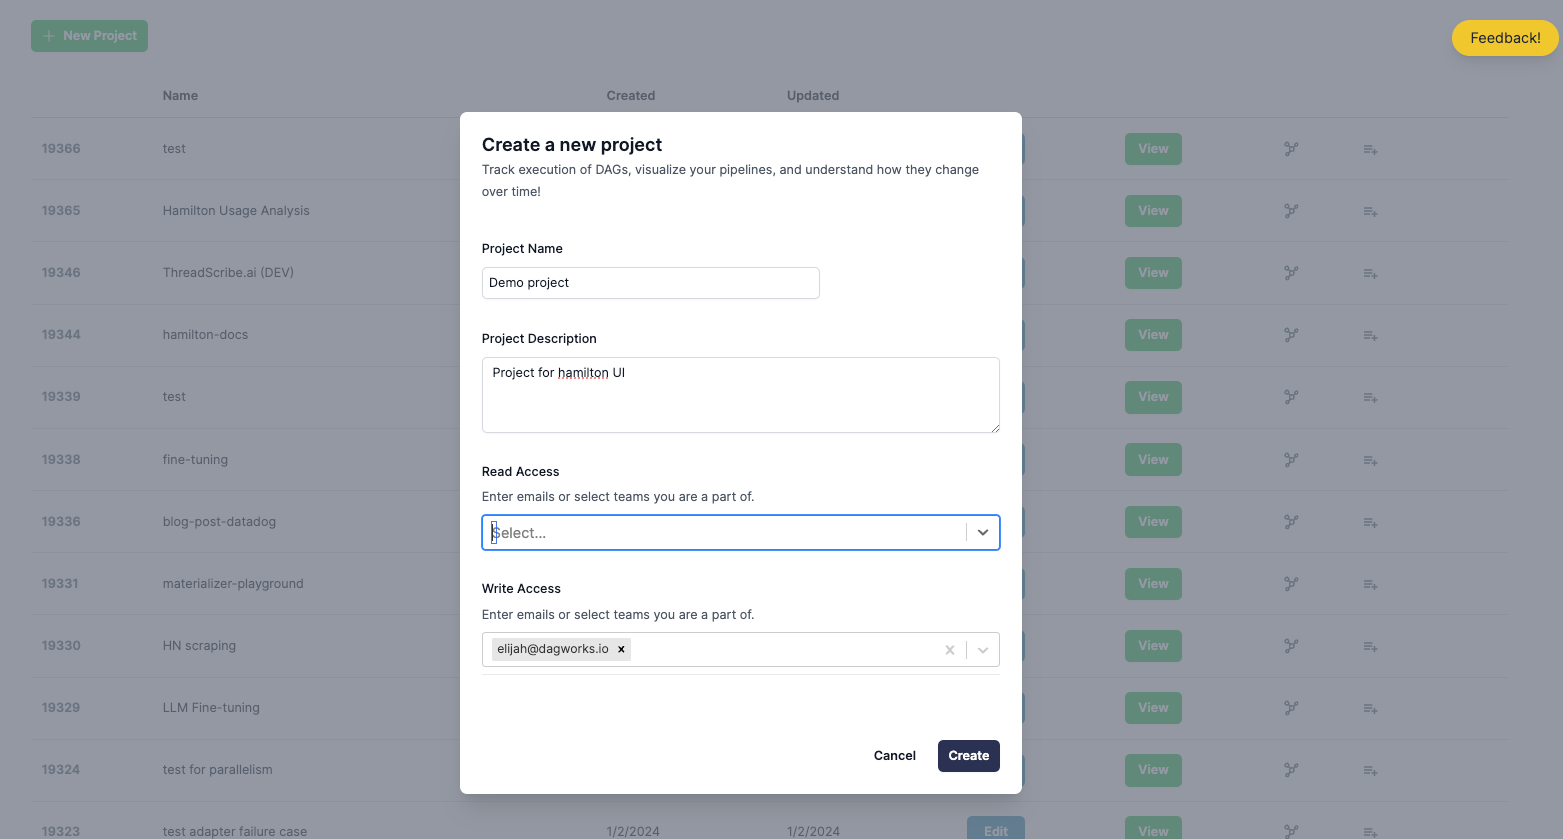
Remember the project ID – you’ll use it for the next steps.
Existing Hamilton Code
Add the following adapter to your code if you have existing Hamilton code:
from hamilton_sdk import adapters

tracker = adapters.HamiltonTracker(
   project_id=PROJECT_ID_FROM_ABOVE,
   username="EMAIL_YOU_PUT_IN_THE_UI",
   dag_name="my_version_of_the_dag",
   tags={"environment": "DEV", "team": "MY_TEAM", "version": "X"}
)

dr = (
  driver.Builder()
    .with_config(your_config)
    .with_modules(*your_modules)
    .with_adapters(tracker)
    .build()
)
Then run your DAG, and follow the links in the logs!
I need some Hamilton code to run
If you don’t have Hamilton code to run this with, you can run Hamilton UI example under examples/hamilton_ui:
# we assume you're in the Hamilton repository root
cd examples/hamilton_ui
# make sure you have the right python packages installed
pip install -r requirements.txt
# run the pipeline providing the email and project_id you created in the UI
python run.py --email <email> --project_id <project_id>
You should see links in the logs to the UI, where you can see the DAG run + the data summaries captured.
Exploring the UI
Once you get to the UI, you can navigate to the projects page (left hand nav-bar). Assuming you have created a project and logged to it, you can then navigate to view it and then more details about it. E.g. versions, code, lineage, catalog, execution runs. See below for a few screenshots of the UI.
Features
The UI has the following features:
DAG version tracking
Select DAG versions to compare + visualize.
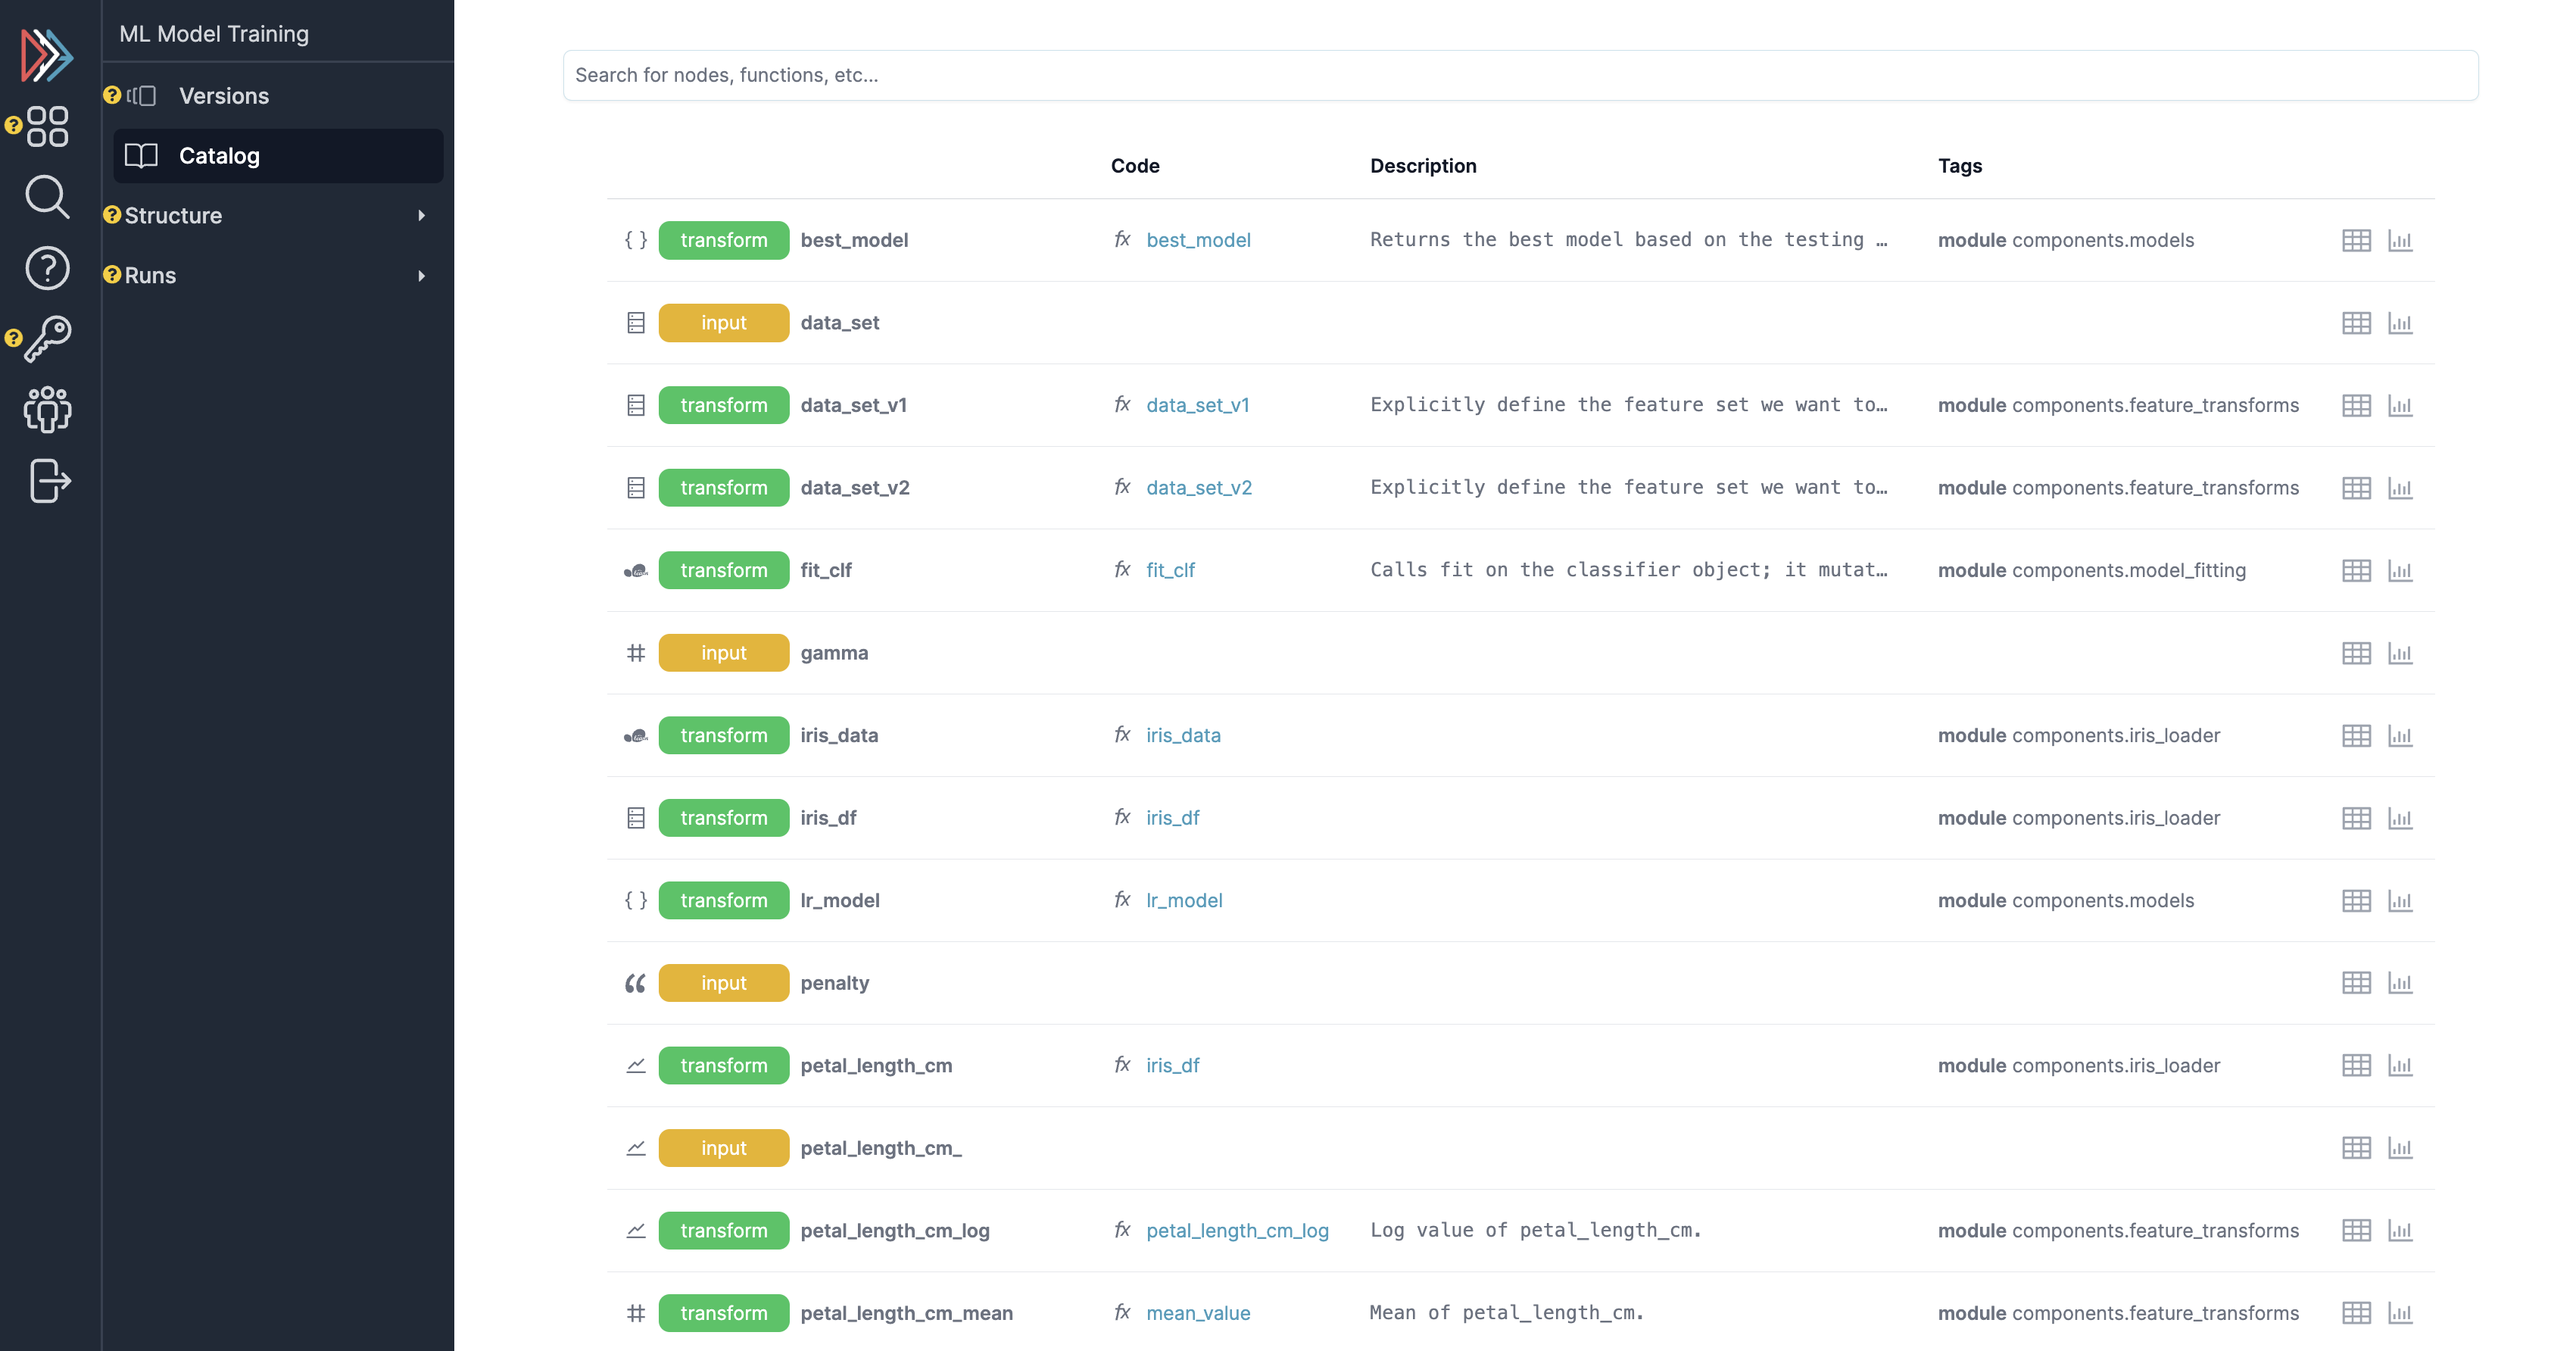
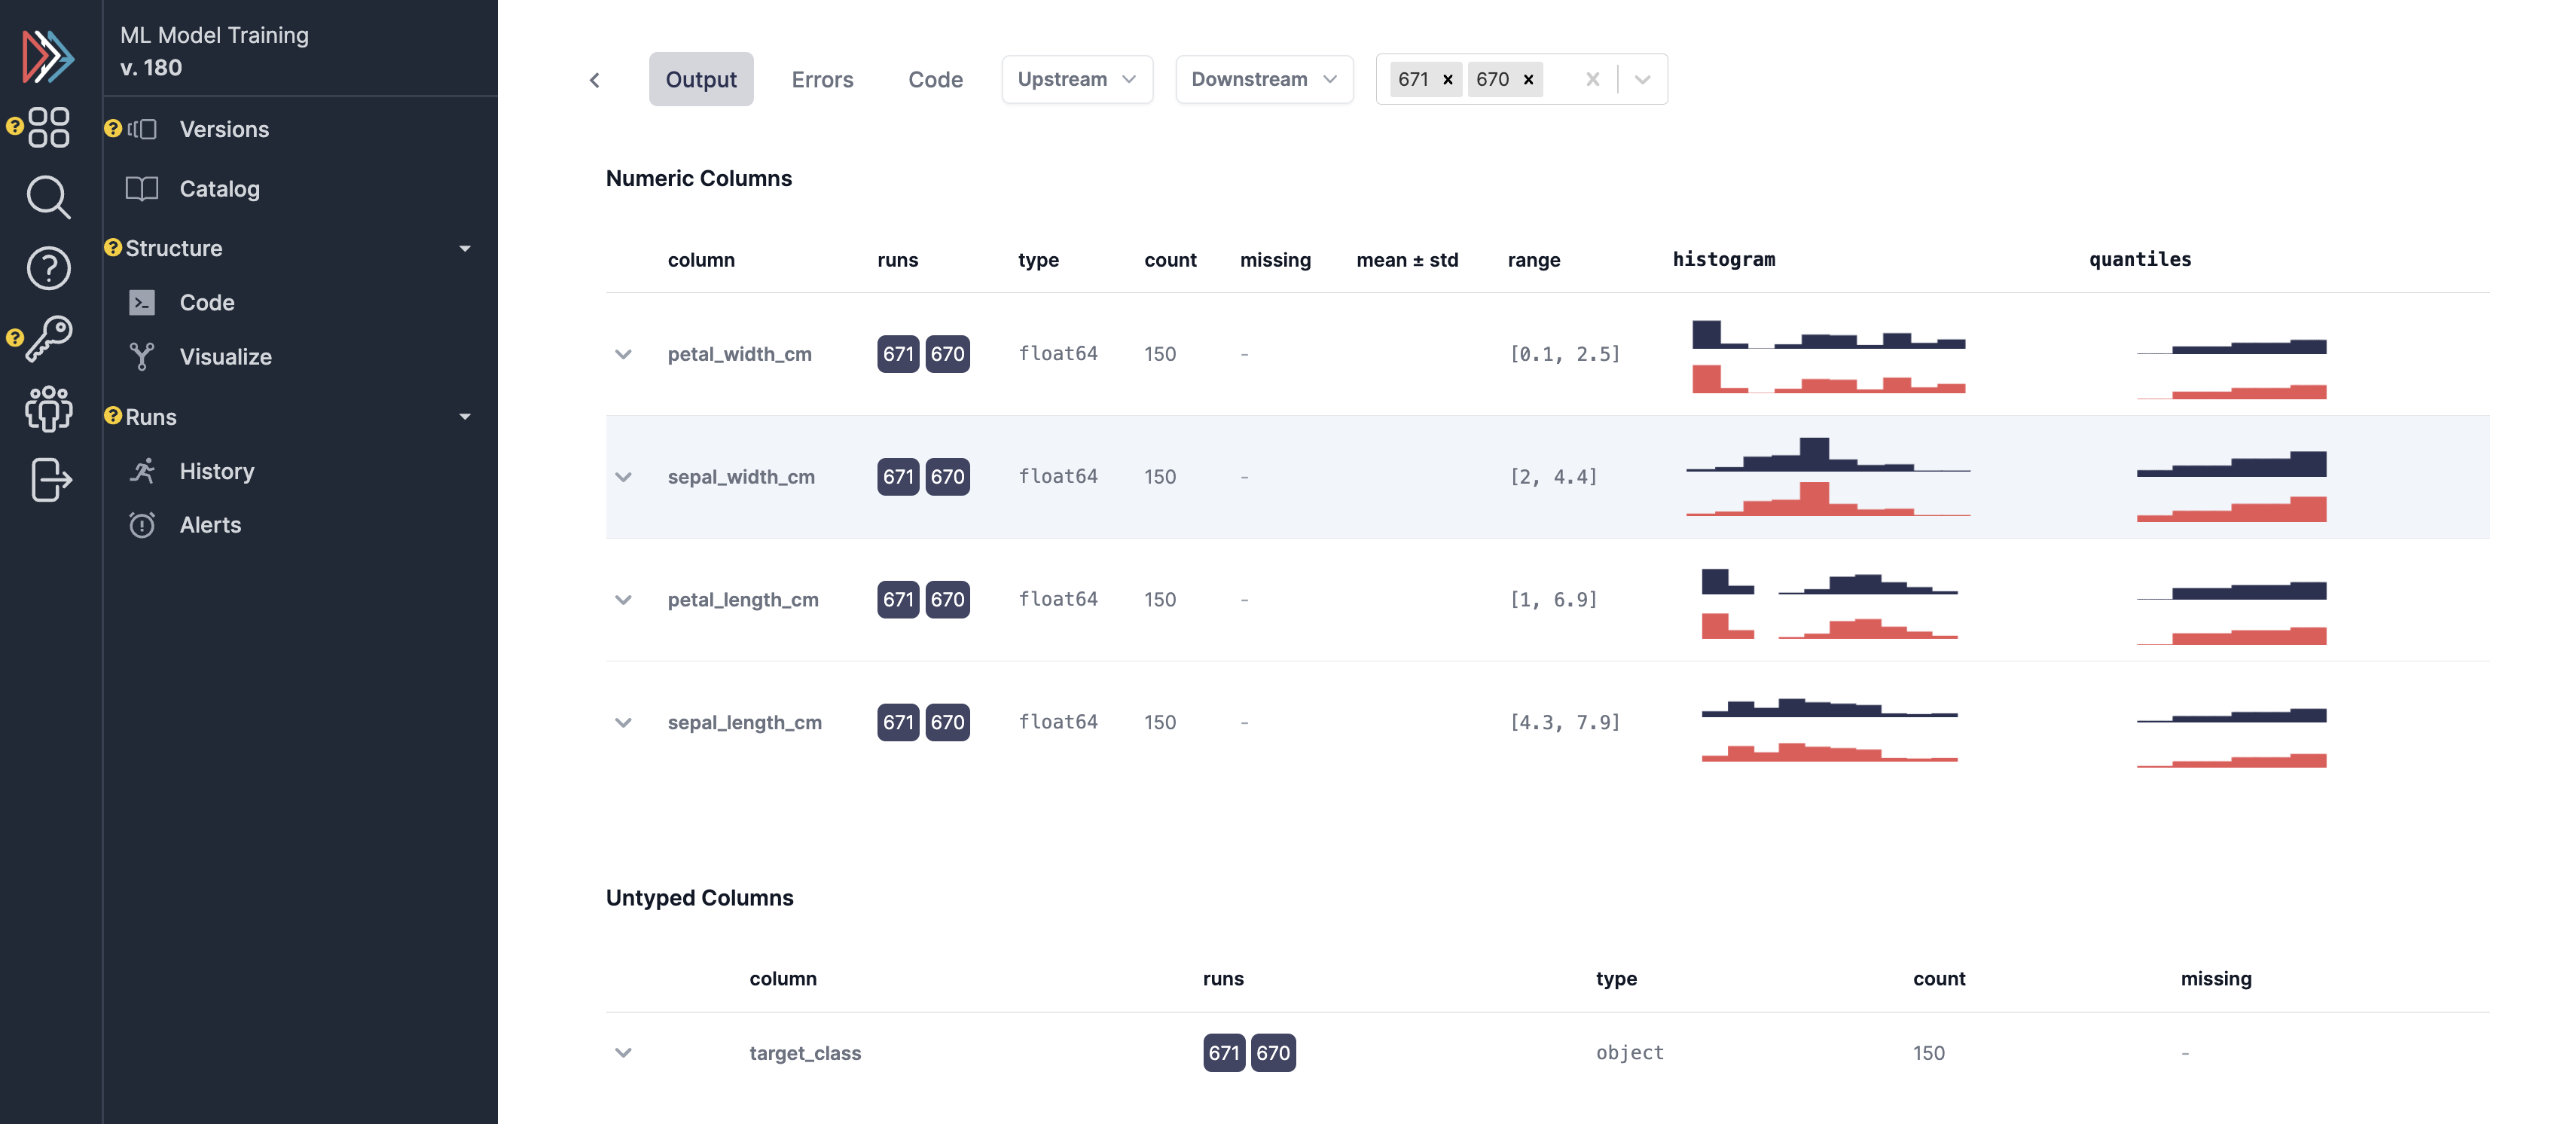
Feature/asset Catalog
View functions, nodes, and assets across a history of runs.
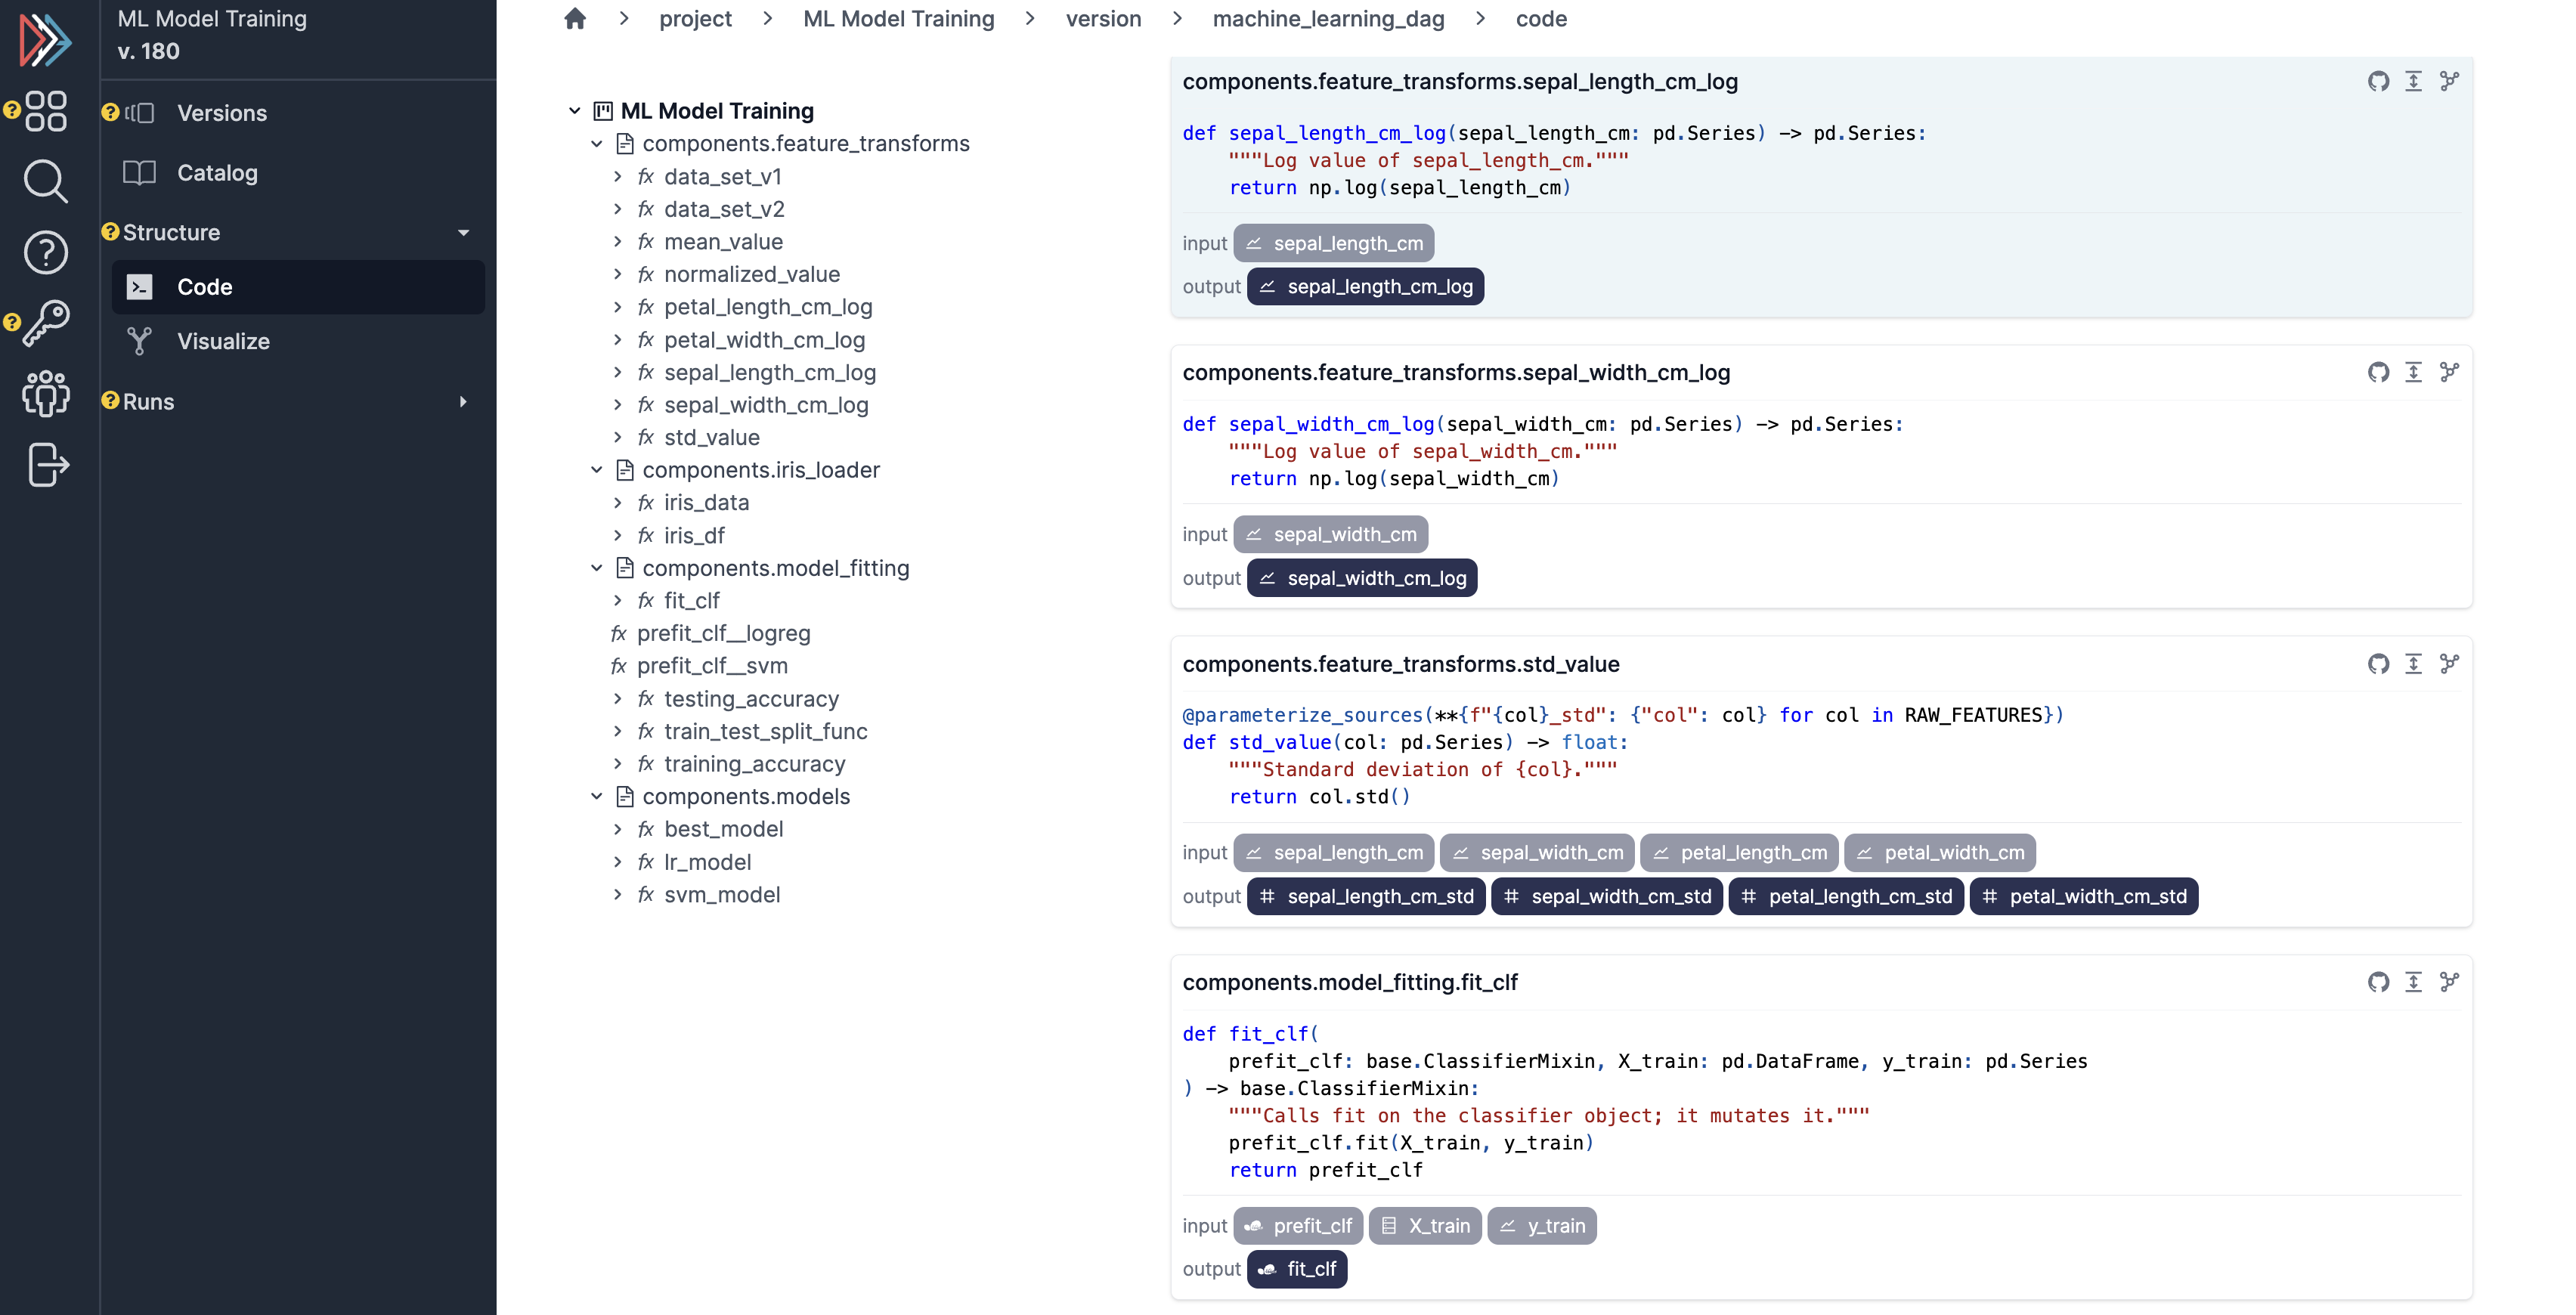
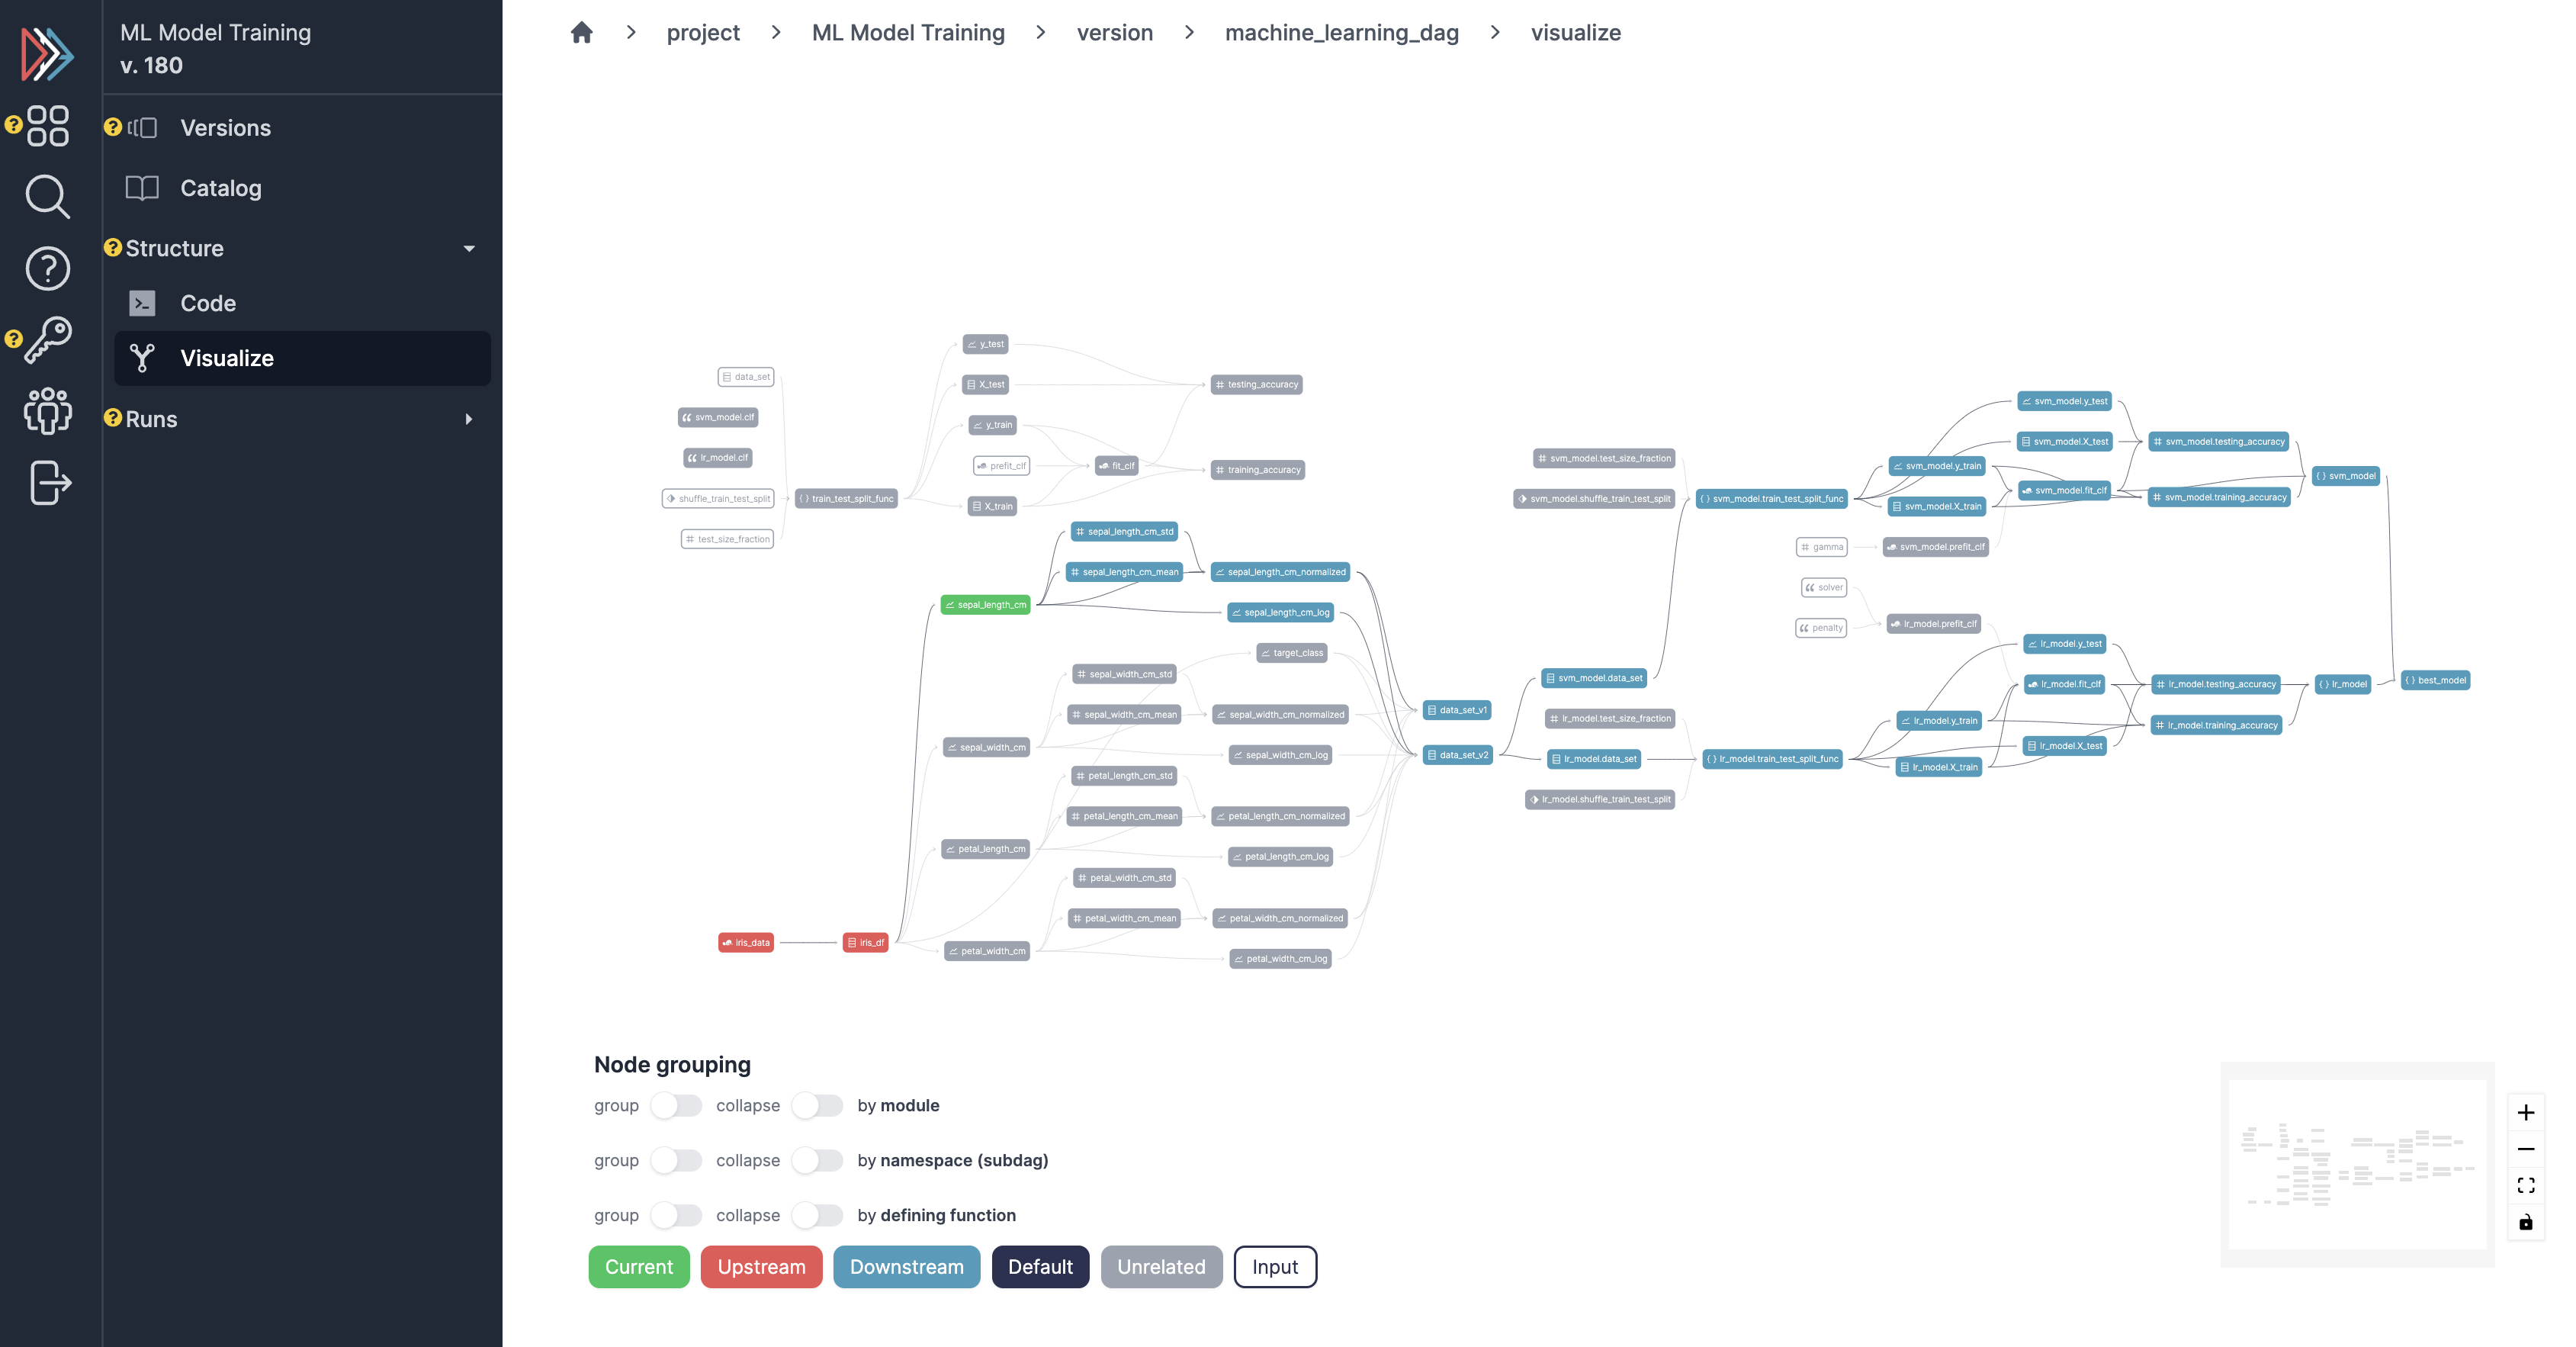
Browser
View DAG shapes + code:
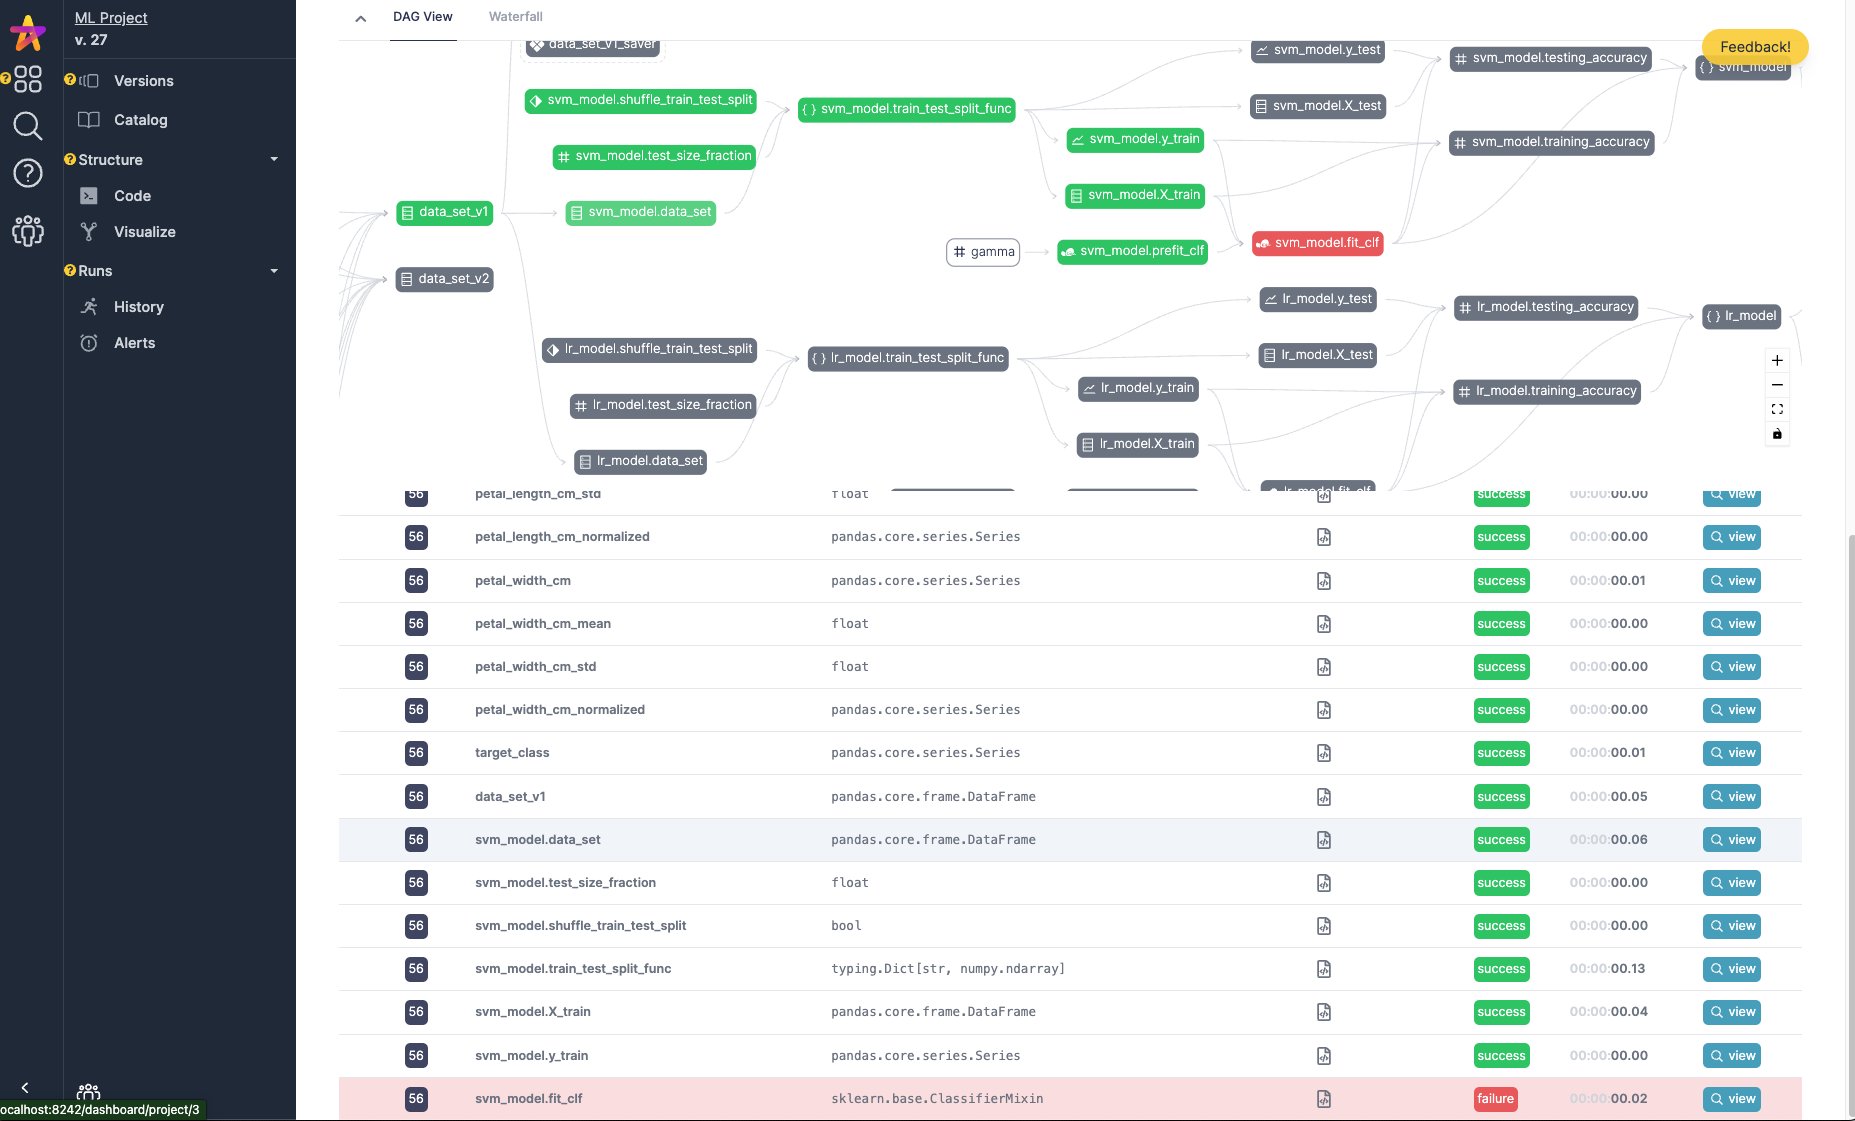
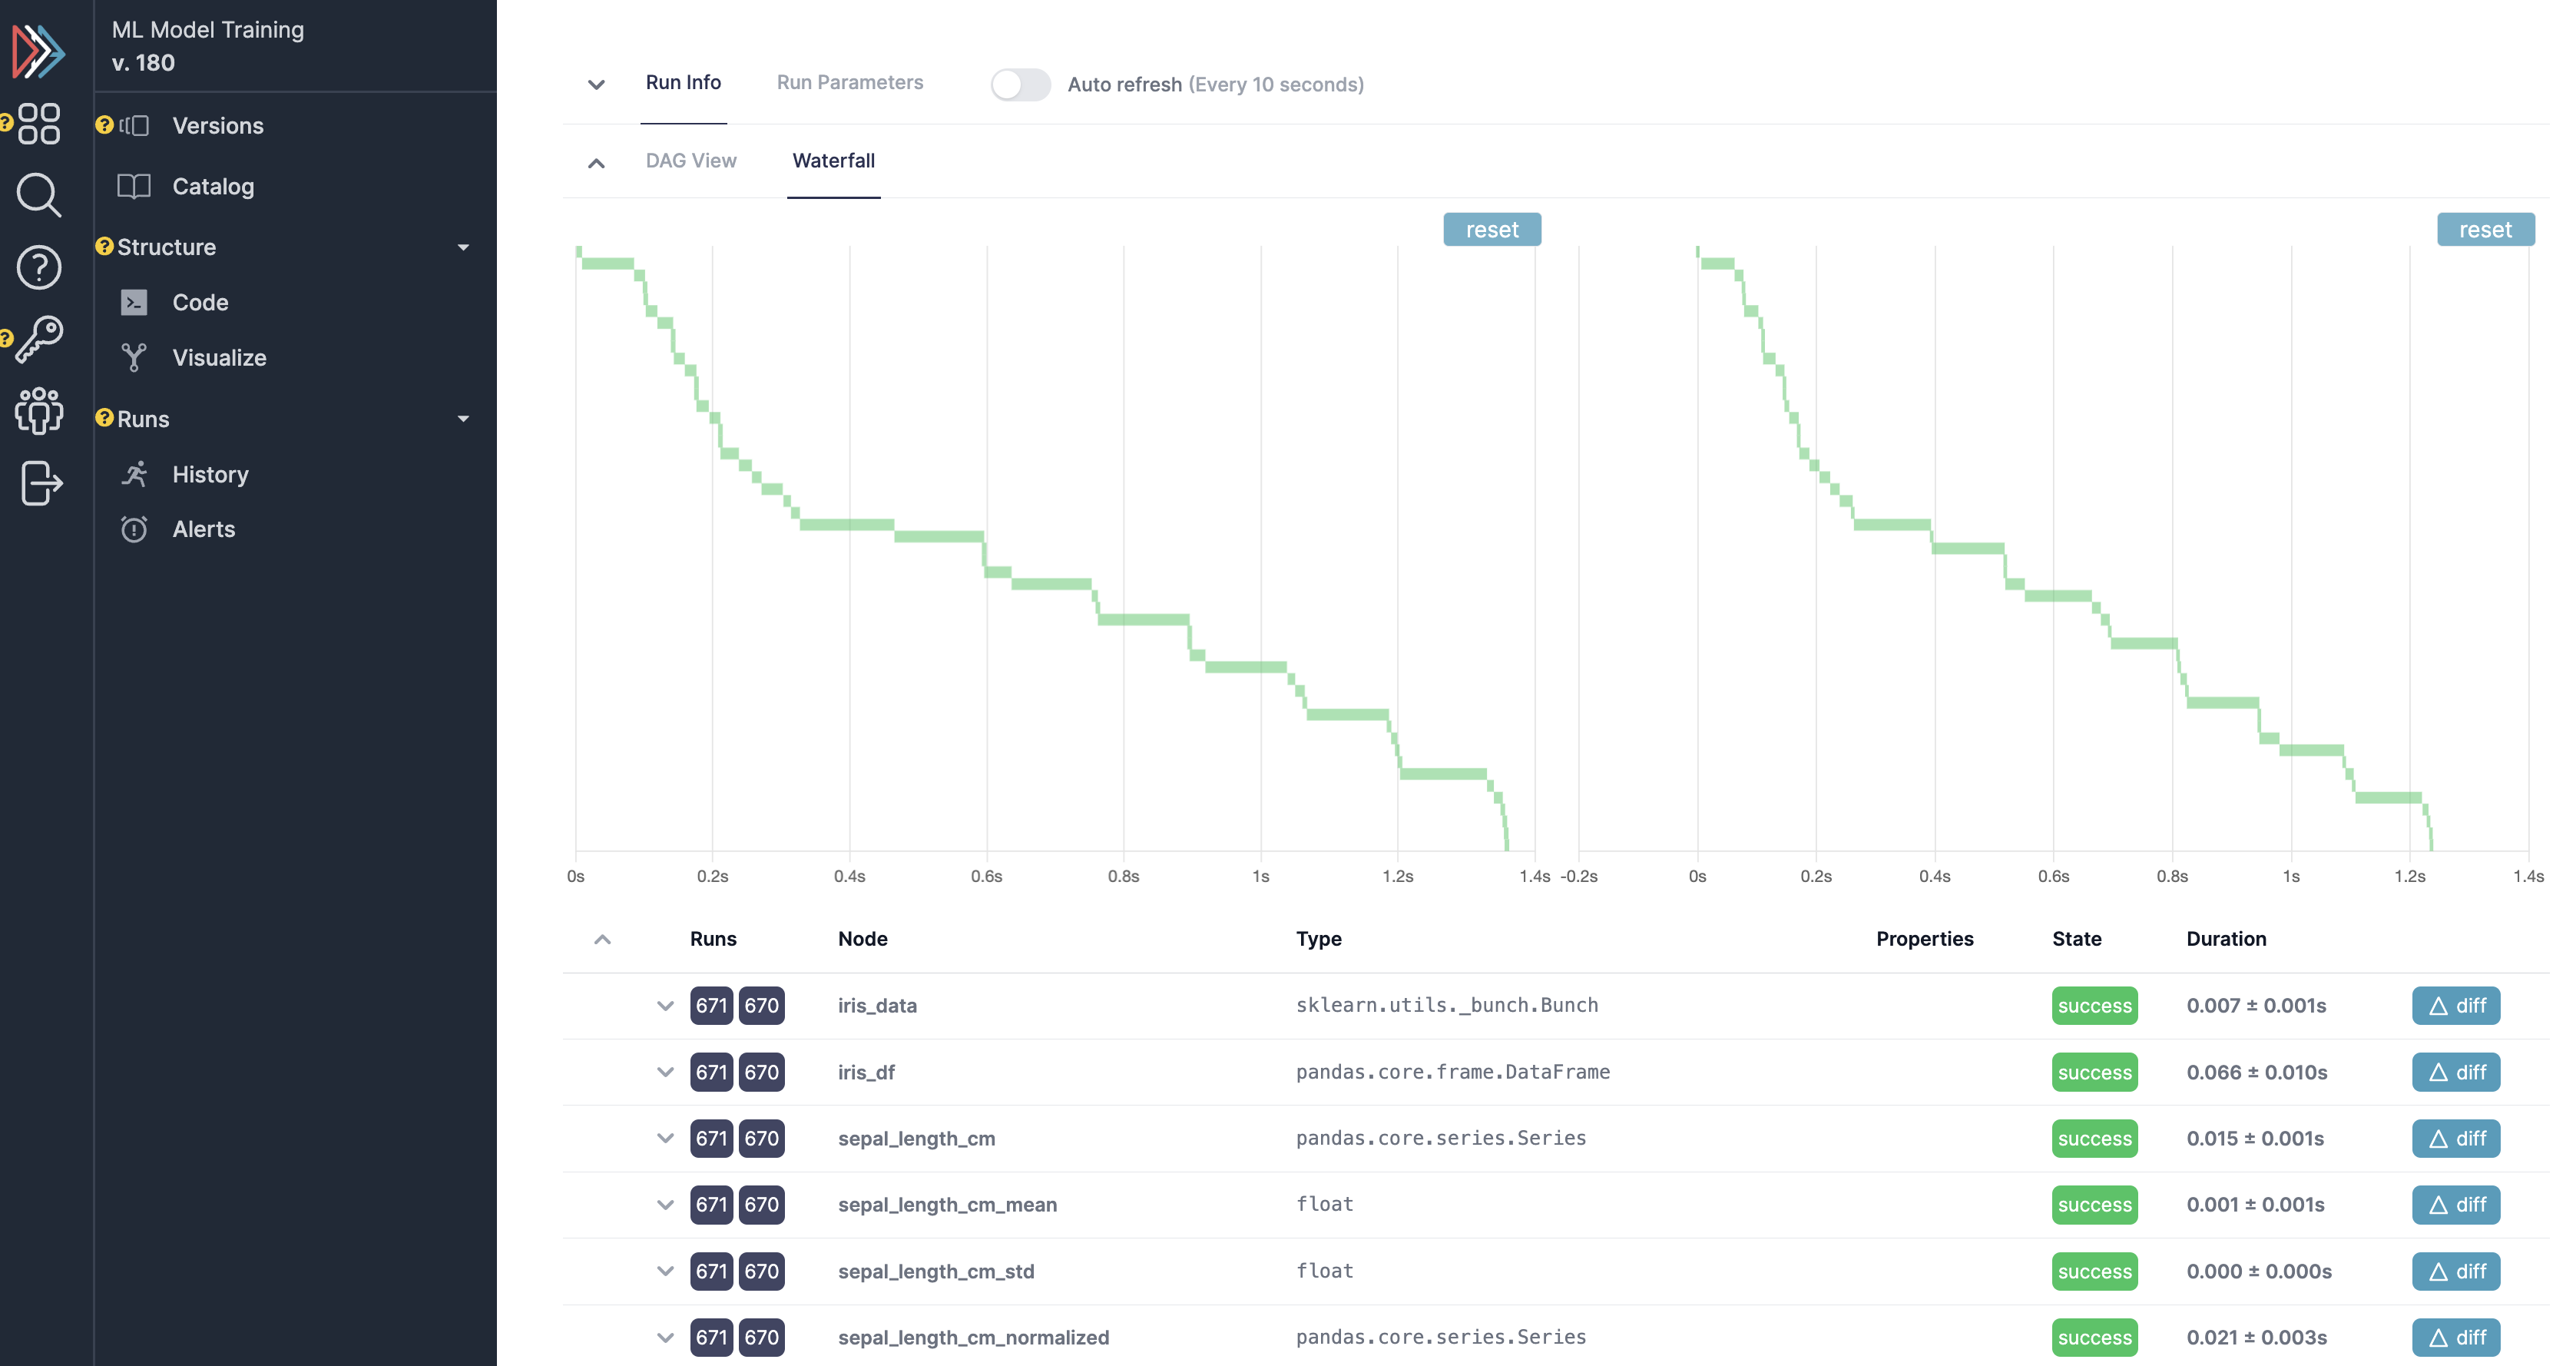
Run tracking + telemetry
View a history of runs, telemetry on runs/comparison, and data for specific runs:
Self-Hosting
Please reach out to us if you want to deploy on your own infrastructure. Self-hosting documentation will be up soon.